Controlling vertex labels in GraphWidget

Hi, I apologise for the long post. I am trying to draw an evolving graph and create some snapshots every year. I want to show the growth of the graph by increasing the size of the nodes and the size of the node labels. In the beginning because my node labels were long, drawing the graph caused the nodes to fully enclose the label (example attached), despite any effort to control their size programmatically, making the graph unreadable. Then I discovered the (undocumented?) parameter "vertex_text_position" and started setting it to e.g. 4. Now whenever the nodes grow in size, as the time goes by, the labels are being displaced far away from the corresponding nodes. Three questions: 1. What are the possible values for "vertex_text_position" and what is their meaning 2. Why are the labels being displaced when node grows in size instead of staying next to the node and 3. Is it possible to align the label at center of the node and at the same time ensure the node size is not adjusted to cover the entire label? My code looks approximately like that: pos = g.new_vertex_property("vector<double>") col = g.new_vertex_property("vector<double>") vf_size = g.new_vertex_property("float") for v in g.vertices(): pos[g.vertex(v)] = [float(g.vp['x'][v]), float(g.vp['y'][v])] # load layout from the existing file col[g.vertex(v)] = [int(g.vp['r'][v])/255.0, int(g.vp['g'][v])/255.0, int(g.vp['b'][v])/255.0, 0.8] if not offscreen: win = GraphWindow(g, pos=pos, geometry=(1024, 768), edge_color=[0.6, 0.6, 0.6, 1], vertex_fill_color=col, ) else: win.graph = GraphWidget(g, pos=pos, edge_color=[0.8, 0.8, 0.8, 1], vertex_fill_color=col, vertex_size=g.vp.size, vertex_text=g.vp.label, vertex_text_position=4, vertex_font_size=vf_size, vertex_font_family="sans-serif" ) win.add(win.graph) def update_state(): # Some logic to filter the graph, keep the nodes # that are active at specific milestones # and call pixbuf.savev global count v_list = nodes_in_years[count] # maintains the nodes of that year for v in v_list: active[v] = True for e in list(v.out_edges()): e_active[e] = True g.set_vertex_filter(active) g.set_edge_filter(e_active) for v in g.vertices(): g.vp.size[v] = v.in_degree()*0.9 + 1 # This has a dynamic effect of the node sizes vf_size[v] = v.in_degree()/2.0 # changes the font size win.graph.regenerate_surface() win.graph.queue_draw() # if doing an offscreen animation, dump frame to disk if offscreen: pixbuf = win.get_pixbuf() pixbuf.savev(r'./frames/graph%04d.png' % count, 'png', [], []) if count > years[-1]: sys.exit(0) count += 1 # We need to return True so that the main loop will call this function more # than once. return True Thank you Yannis

Funny, this used to be documented. It seems the "List of vertex properties" got erased from the graph.draw documentation by accident. If I remember right, positive values for text_position are angles for the text to be placed outside the vertex, while negative values cause the text to be centered, where -1 causes the vertex to expand with the text. Try setting your text_position to -2 and see if that achieves what you want. Also, it always helps us to help you if you provide a self-contained, minimal example of your issue. Cheers On Thu, Oct 8, 2015 at 6:11 PM, yannis panagis <ypanagis@hotmail.com> wrote:
Hi,
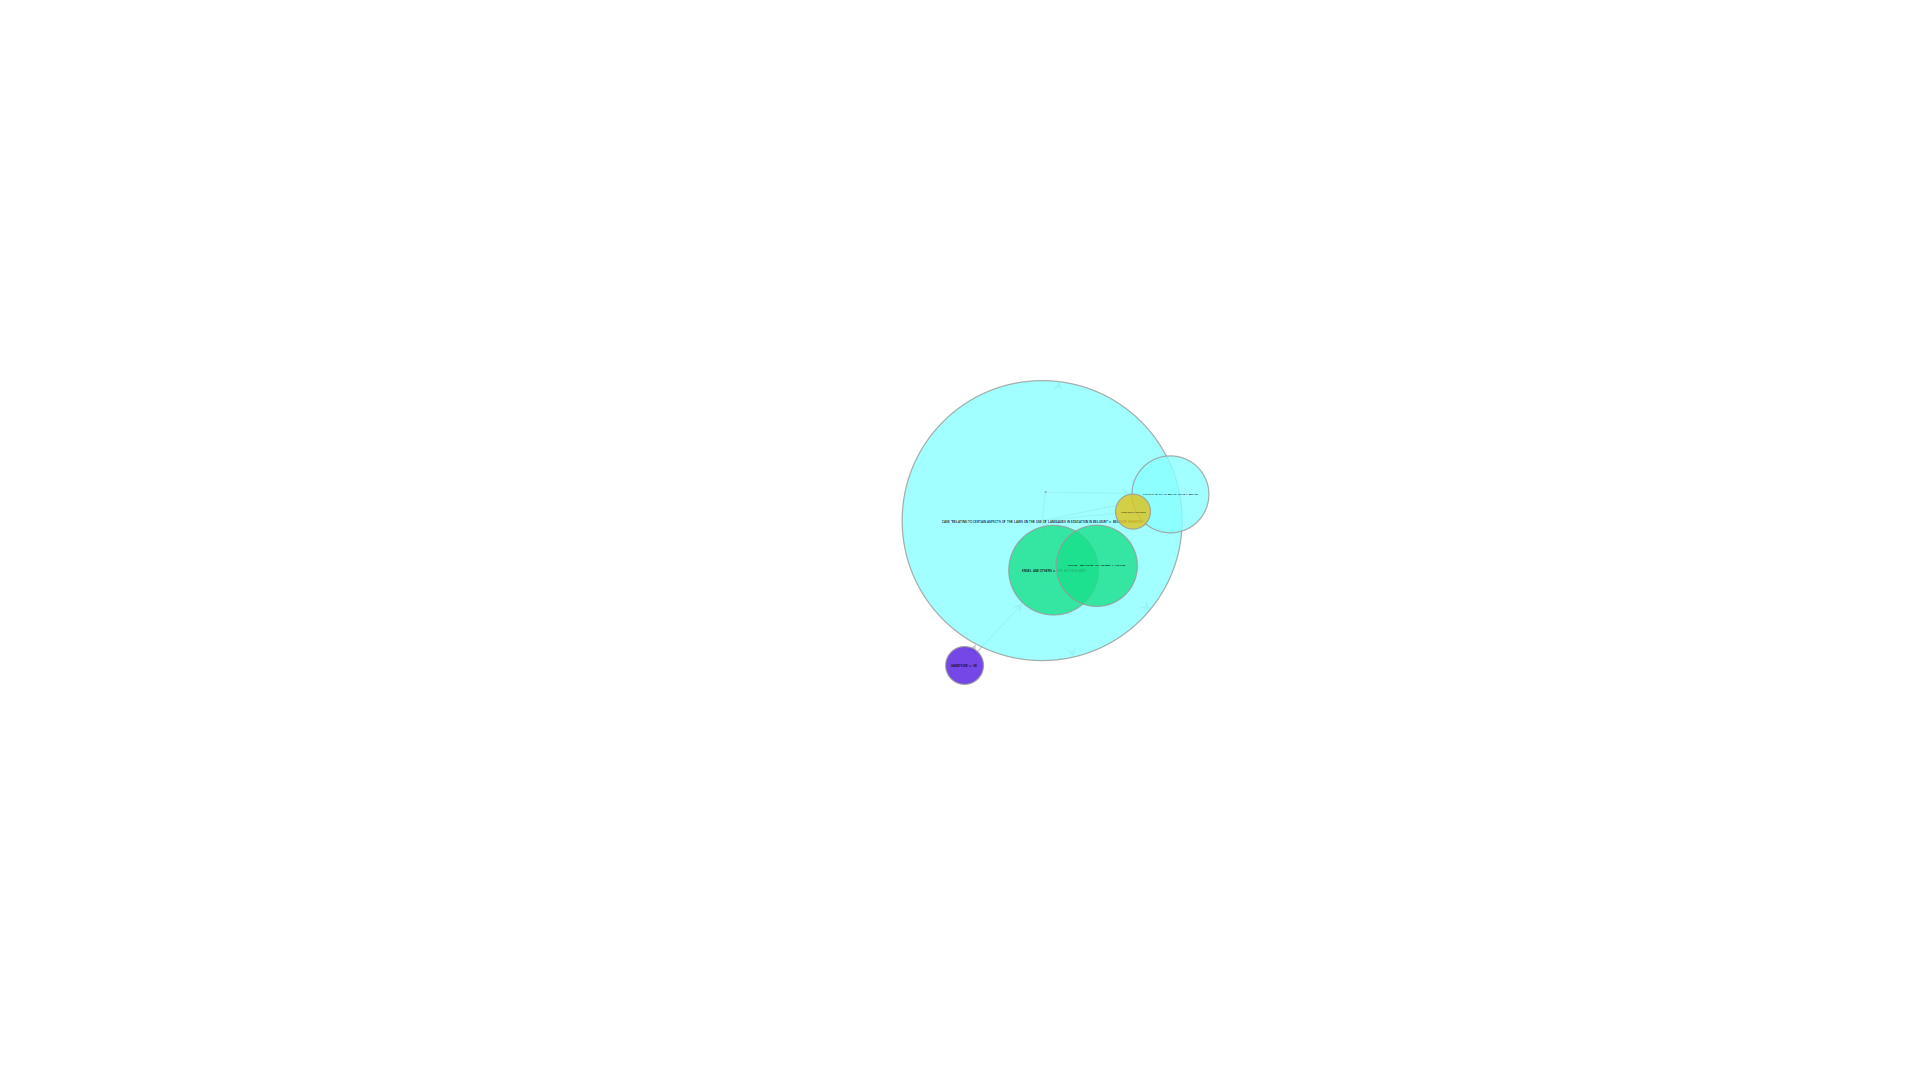
I apologise for the long post. I am trying to draw an evolving graph and create some snapshots every year. I want to show the growth of the graph by increasing the size of the nodes and the size of the node labels. In the beginning because my node labels were long, drawing the graph caused the nodes to fully enclose the label (example attached), despite any effort to control their size programmatically, making the graph unreadable.
Then I discovered the (undocumented?) parameter "vertex_text_position" and started setting it to e.g. 4. Now whenever the nodes grow in size, as the time goes by, the labels are being displaced far away from the corresponding nodes.
Three questions: 1. What are the possible values for "vertex_text_position" and what is their meaning 2. Why are the labels being displaced when node grows in size instead of staying next to the node and 3. Is it possible to align the label at center of the node and at the same time ensure the node size is not adjusted to cover the entire label?
My code looks approximately like that:
pos = g.new_vertex_property("vector<double>") col = g.new_vertex_property("vector<double>") vf_size = g.new_vertex_property("float")
for v in g.vertices(): pos[g.vertex(v)] = [float(g.vp['x'][v]), float(g.vp['y'][v])] # load layout from the existing file col[g.vertex(v)] = [int(g.vp['r'][v])/255.0, int(g.vp['g'][v])/255.0, int(g.vp['b'][v])/255.0, 0.8]
if not offscreen: win = GraphWindow(g, pos=pos, geometry=(1024, 768), edge_color=[0.6, 0.6, 0.6, 1], vertex_fill_color=col, )
else:
win.graph = GraphWidget(g, pos=pos, edge_color=[0.8, 0.8, 0.8, 1], vertex_fill_color=col, vertex_size=g.vp.size, vertex_text=g.vp.label, vertex_text_position=4, vertex_font_size=vf_size, vertex_font_family="sans-serif" ) win.add(win.graph)
def update_state(): # Some logic to filter the graph, keep the nodes # that are active at specific milestones # and call pixbuf.savev
global count v_list = nodes_in_years[count] # maintains the nodes of that year for v in v_list: active[v] = True for e in list(v.out_edges()): e_active[e] = True
g.set_vertex_filter(active) g.set_edge_filter(e_active) for v in g.vertices(): g.vp.size[v] = v.in_degree()*0.9 + 1 # This has a dynamic effect of the node sizes vf_size[v] = v.in_degree()/2.0 # changes the font size
win.graph.regenerate_surface() win.graph.queue_draw()
# if doing an offscreen animation, dump frame to disk if offscreen: pixbuf = win.get_pixbuf() pixbuf.savev(r'./frames/graph%04d.png' % count, 'png', [], []) if count > years[-1]: sys.exit(0) count += 1
# We need to return True so that the main loop will call this function more # than once. return True
Thank you Yannis
_______________________________________________ graph-tool mailing list graph-tool@skewed.de http://lists.skewed.de/mailman/listinfo/graph-tool

On 09.10.2015 04:27, Alexandre Hannud Abdo wrote:
Funny, this used to be documented. It seems the "List of vertex properties" got erased from the graph.draw documentation by accident.
Ugh, it seem the table got malformed because of a single space, and sphinx refused to render it. You can still see the full documentation in the docstring, i.e. help(graph_draw) I'll fix it in the website. Best, Tiago -- Tiago de Paula Peixoto <tiago@skewed.de>
This worked thank you very much.
Also, it always helps us to help you if you provide a self-contained, minimal example of your issue.
True, the thing is that I am using the data in a research project and it would take some time for me to anonymize and simplify the code but you are right in any case Cheers Yannis Date: Thu, 8 Oct 2015 23:27:54 -0300 From: abdo@member.fsf.org To: graph-tool@skewed.de Subject: Re: [graph-tool] Controlling vertex labels in GraphWidget Funny, this used to be documented. It seems the "List of vertex properties" got erased from the graph.draw documentation by accident. If I remember right, positive values for text_position are angles for the text to be placed outside the vertex, while negative values cause the text to be centered, where -1 causes the vertex to expand with the text. Try setting your text_position to -2 and see if that achieves what you want. Also, it always helps us to help you if you provide a self-contained, minimal example of your issue. Cheers On Thu, Oct 8, 2015 at 6:11 PM, yannis panagis <ypanagis@hotmail.com> wrote: Hi, I apologise for the long post. I am trying to draw an evolving graph and create some snapshots every year. I want to show the growth of the graph by increasing the size of the nodes and the size of the node labels. In the beginning because my node labels were long, drawing the graph caused the nodes to fully enclose the label (example attached), despite any effort to control their size programmatically, making the graph unreadable. Then I discovered the (undocumented?) parameter "vertex_text_position" and started setting it to e.g. 4. Now whenever the nodes grow in size, as the time goes by, the labels are being displaced far away from the corresponding nodes. Three questions: 1. What are the possible values for "vertex_text_position" and what is their meaning 2. Why are the labels being displaced when node grows in size instead of staying next to the node and 3. Is it possible to align the label at center of the node and at the same time ensure the node size is not adjusted to cover the entire label? My code looks approximately like that: pos = g.new_vertex_property("vector<double>") col = g.new_vertex_property("vector<double>") vf_size = g.new_vertex_property("float") for v in g.vertices(): pos[g.vertex(v)] = [float(g.vp['x'][v]), float(g.vp['y'][v])] # load layout from the existing file col[g.vertex(v)] = [int(g.vp['r'][v])/255.0, int(g.vp['g'][v])/255.0, int(g.vp['b'][v])/255.0, 0.8] if not offscreen: win = GraphWindow(g, pos=pos, geometry=(1024, 768), edge_color=[0.6, 0.6, 0.6, 1], vertex_fill_color=col, ) else: win.graph = GraphWidget(g, pos=pos, edge_color=[0.8, 0.8, 0.8, 1], vertex_fill_color=col, vertex_size=g.vp.size, vertex_text=g.vp.label, vertex_text_position=4, vertex_font_size=vf_size, vertex_font_family="sans-serif" ) win.add(win.graph) def update_state(): # Some logic to filter the graph, keep the nodes # that are active at specific milestones # and call pixbuf.savev global count v_list = nodes_in_years[count] # maintains the nodes of that year for v in v_list: active[v] = True for e in list(v.out_edges()): e_active[e] = True g.set_vertex_filter(active) g.set_edge_filter(e_active) for v in g.vertices(): g.vp.size[v] = v.in_degree()*0.9 + 1 # This has a dynamic effect of the node sizes vf_size[v] = v.in_degree()/2.0 # changes the font size win.graph.regenerate_surface() win.graph.queue_draw() # if doing an offscreen animation, dump frame to disk if offscreen: pixbuf = win.get_pixbuf() pixbuf.savev(r'./frames/graph%04d.png' % count, 'png', [], []) if count > years[-1]: sys.exit(0) count += 1 # We need to return True so that the main loop will call this function more # than once. return True Thank you Yannis _______________________________________________ graph-tool mailing list graph-tool@skewed.de http://lists.skewed.de/mailman/listinfo/graph-tool _______________________________________________ graph-tool mailing list graph-tool@skewed.de http://lists.skewed.de/mailman/listinfo/graph-tool
On 08.10.2015 23:11, yannis panagis wrote:
Three questions: 1. What are the possible values for "vertex_text_position" and what is their meaning 2. Why are the labels being displaced when node grows in size instead of staying next to the node and 3. Is it possible to align the label at center of the node and at the same time ensure the node size is not adjusted to cover the entire label?
If you do help(graph_draw) you will see: text_position: Position of the text relative to the vertex. If the passed value is positive, it will correspond to an angle in radians, which will determine where the text will be placed outside the vertex. If the value is negative, the text will be placed inside the vertex. If the value is ``-1``, the vertex size will be automatically increased to accommodate the text. The special value ``"centered"`` positions the texts rotated radially around the center of mass. Best, Tiago -- Tiago de Paula Peixoto <tiago@skewed.de>
participants (3)
-
 Alexandre Hannud Abdo
 -
 Tiago de Paula Peixoto
 -
 yannis panagis