
30 Nov
2012
30 Nov
'12
5:37 p.m.
On 11/30/2012 06:25 PM, Tiago de Paula Peixoto wrote:
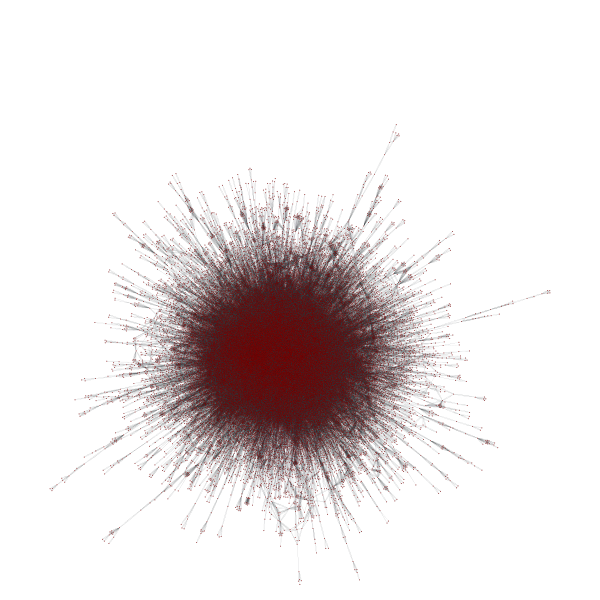
g = GraphView(g, vfilt=label_largest_component(g)) pos = sfdp_layout(g, verbose=True) # This way you get more information # about the layout progress graph_draw(g, pos=pos, output="output.png")
BTW, this took only a couple of minutes on my laptop. The result is attached. Unfortunately, the result is pretty much a ridiculogram[1], as is often the case for large networks, which are not tree-like. [1] http://www.youtube.com/watch?v=YS-asmU3p_4 -- Tiago de Paula Peixoto <tiago@skewed.de>